Tuesday 5 December 2017

Real-Time Prices Now Inside Our Screener

Are you looking for a real time stock screener on which you can run all your favorite stock scans?

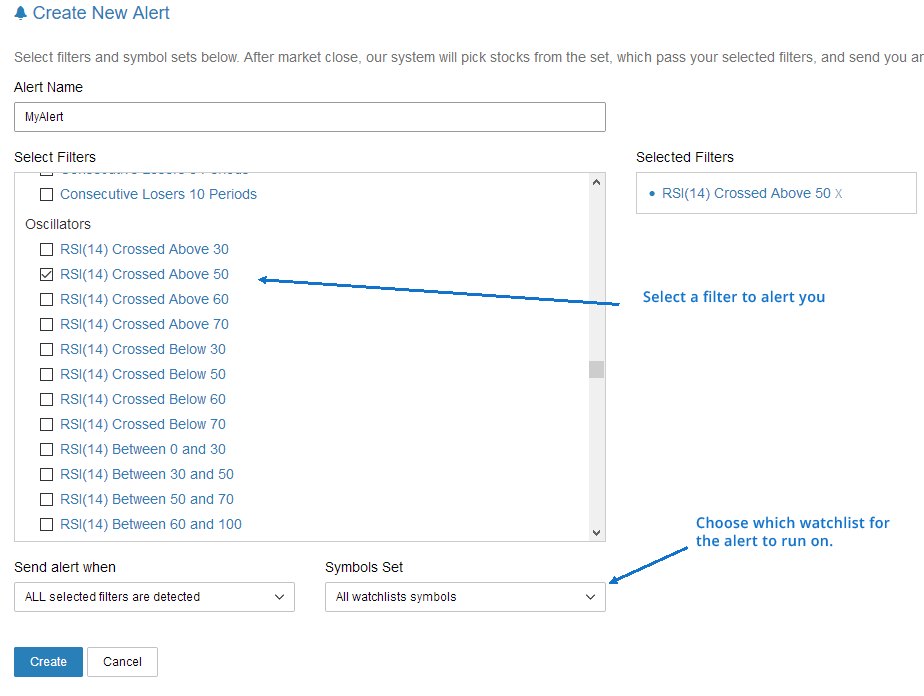
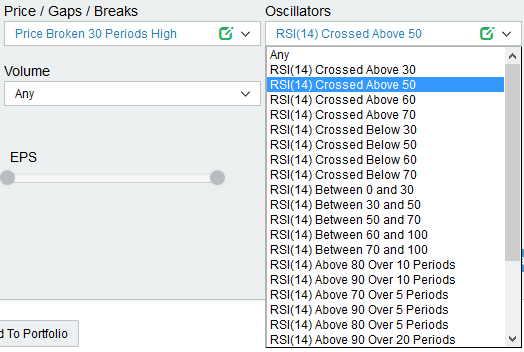
Well here’s the good news. Stock monitor has now integrated real-time data from IEX. This means you can now build unlimited custom filters and scan the whole market in real time.

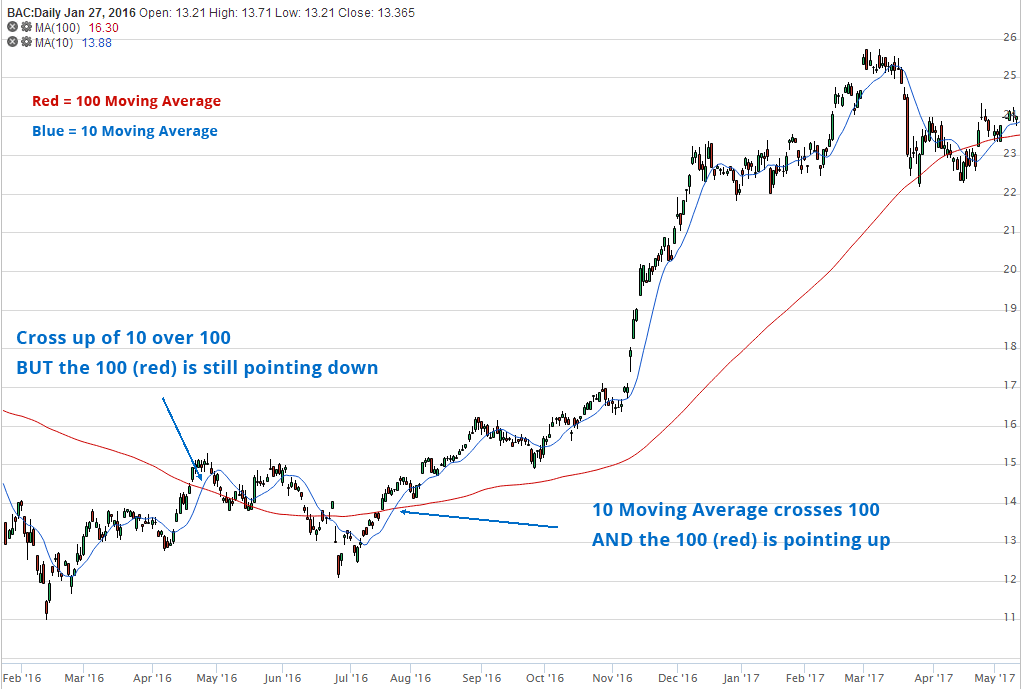
Until recently StockMonitor ran on 15 minute delayed data. By integrating with IEX it means daytraders can use real-time data which is essential to detect breakouts, gaps and other types of technical analysis which rely on live prices.

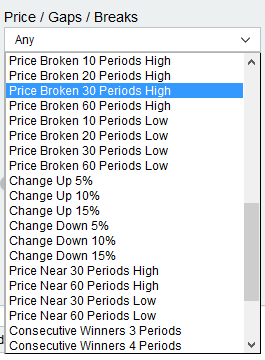
For instance if you are a trader who likes to catch breakouts of a 10 day high, now you can detect them happening within a minute of the market opening. In the past you would have to wait 15 minutes before seeing the data.

Real-Time Stock Watch List and Portfolio

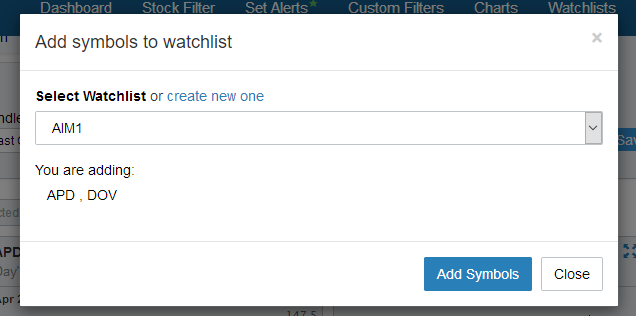
Even if you are not a day trader real-time data still has many benefits. There are many people looking for Google finance alternative. Portfolios were a really cool feature of Google finance but recently they decided to discontinue this feature. You can now create unlimited real-time watchlists for your stocks or unlimited real time stock portfolios inside stock monitor.

With our real time stock portfolio you can add buy and sell transactions and keep track of the value of your investment portfolio in real time.

The best thing is we are not going to change the price of our service, even though we have integrated this brand-new real-time data. We are committed to providing value for money service.

It is our commitment to providing value for customers which makes us feel we are the best paid stock screener available. For our low monthly price you get access to real-time data in your stock portfolios, stock charts, custom filters, stock portfolios, back tests and more.

If you want to test our real time data, then try out our totally free 14 day trial. No payment details are needed to try us out, simply enter your email and start today on real-time data.


Take from https://www.stockmonitor.com/blog/real-time-prices-now-inside-our-screener/

Sunday 2 July 2017

Is a Moving Average Crossover The Best Stock Screener?

We have hundreds of pre-set stock scanners, but one of the most used is to detect a moving average crossover. Many people use these, and according to our internal statistics this is the best stock screener, or maybe the most popular here anyway. But why is this simple screener being used so much?

Moving Averages are a simple but effective indicator. As the name implies, they are displayed as an average line of movement between the close points, over a set period. Popular periods are 50 days, 100 days or 200 days.

But the beauty of moving averages is you can also use very short time periods to create a crossover of a longer period.

For example a 100 period moving average is a semi long term indication of trend direction. If prices are trading above this average, and the average is pointing upwards then prices will generally be heading up (maybe with a few downs in between). By adding a shorter time frame moving average, say 10 period, you are seeing if the 10 day movement/trend is crossing up or down over the longer term movement.

Let me show you a chart with some explanations, and show you why using a screener is the best way to detect these crossovers.

moving-average-cross-chart

As you can see the first cross up, the 100 moving average was still pointing down. This suggests the trend still has to turn. A few ups and downs (creating higher lows) over a few weeks helped the average point up, and the next time the 10 crossed above the trend took off and didn’t stop.

Granted this is a good example, but you can see why people think the best stock screener here is the moving average crossover.

The great thing about our screener is you can customize the periods of the averages to suit your style of trading, and also add in further criteria such as low or high RSI etc.

You do this by starting on the main filter area and selecting one of our pre-set scanners. Then once it is selected you will see a green edit/clone icon like below.

clone-screener

Once you click this you can then give your new screener a name, and edit the settings. It will then be available in the custom filters box on the main filter area, and you can also back test or set end of day email alerts when this filter detects new crossovers.

Give it a try. I’m sure you will find it easy to get started.

Further Reading

Try looking at another article on how to set up a moving average crossover screener, or how to scan for RSI stocks which are both good places for traders to start.


Take from https://www.stockmonitor.com/blog/is-a-moving-average-crossover-the-best-stock-screener/

Thursday 8 June 2017

How You Can Find Low RSI Stocks and Set Stock Alerts

Whilst a lot of traders buy trending stocks which are breaking out higher, there’s also a large camp who like to buy the dips. If you can identify an edge which offers a low risk entry into a trending stock, you can catch a good move early.

Here’s a neat way to use our low RSI screener to pull up a bunch of candidates for your watch lists. But first of all you will need a free trial of our platform, click the button below.


Low RSI At Support Levels

When RSI crosses below 50 it is a signal of weakness in a stock, and if approaching a recent low, can offer a good entry into a trend. Use our screener to identify low RSI and then check the mini charts for the results which have pulled back, but are holding above a recent high, or an obvious support level. Here is the RSI in the Oscillators box on our main filter area.

rsi-crossed-50

So now you have a set of results, look for the ones which seem to have pulled back towards a recent high and price is currently in an upward trend. I highlighted two on the mini charts below which would fit this criteria, one had pulled back towards a recent low, one has pulled back towards a support level (which was resistance before shown by the horizontal line).

mini-charts

Select the ones that look good and add them to a watch list, then you can set an alert for a price increase on the stocks in your list. When you get your alert email, check the charts and decide if a trade is possible (using your risk profile).

Add Stocks To Watch List

Directly from the mini charts you select the check box on each stock you would like to save, then click “Add Selected To Watchlist” button in the menu above the results. This will open a prompt box asking whether you want to add them to a previous watch list (select which list from the drop down box) or create a new one. You can create as many watchlists as you need, so don’t be afraid to organize your stocks into date named lists, or even named by sector or price range.

watchlist-create

Now that you have a watchlist of stocks that are retracing with lower RSI, you can set an alert for when stocks in this list begin to rise again.

Setting Stock Alerts

Go to set alerts section and select a filter for a heads up when these stocks are beginning to move upwards again. In this case I have selected RSI crossing above 50 once again, but you can choose any other, or even better create you own. One simple custom filter could simply be close[0] > close[-1] which would alert you when a stock in this list has closed up compared to yesterday (-1 is yesterdays close). See our guides on creating your own custom filter, it’s really easy.

stock-alerts

Wait for your alerts and begin to check the charts. Are the stocks you have picked still in an uptrend? Is the risk (a break of support or low) worth taking? Make sure you have a plan for these trades and perform some analysis on the stocks. You may find a gem in there!

Want to know more?

Learn about scanning for candlestick patterns here or maybe take a look at how to identify breakout stocks and profit from them.


Take from https://www.stockmonitor.com/blog/how-you-can-find-low-rsi-stocks-and-set-stock-alerts/

Monday 6 March 2017

Finding The Best Stocks To Buy Based On Technical Screener Results

Everyone is looking for the best stocks to buy. Obviously we all wish we knew what they were, but one of the best ways of getting an advantage is by using a technical analysis stock screener to inform you when a stock is looking oversold or beginning to gain strength.

Traders and investors look for different technical indicator signals in various timeframes, so in this article I will show you a couple of examples which you could start testing and see if they help you find the best stocks to buy.

Breakout Stocks With Strong RSI

If a stock breaks a psychological level, maybe a 2 month high or a resistance, you can be sure it will be picked up by many traders on their screeners. The trick is not to buy all stocks that break highs, but select ones with the most strength behind the move. You can use our stock breakout screener to find them fast.

Using RSI (Relative Strength Index) is a good gauge to whether the move has been building for a while before the break out. If there was no strength in the move prior to breakout then it can often be a news spike that may retrace.

First, select your index (such as the S&P500) and go to our box titled “Price/Gaps/Break” on the main filter, and run “Price Broken 30 Periods High”. As it states, this will only show stocks whose move today has made a new 30 day high.

breakouts

Once you have this filter selected you can then run a 2nd filter from the Oscillators box of “RSI (14) Crossed Above 50”. When RSI crosses above the 50 line, it is deemed as moving from negative to positive strength.

RSI-cross

This will now narrow down the results to only breakouts which occurred with an RSI cross. If you like the look of these stocks in the charts below the main filter area, select the “eye” icon on the corner of each chart and add them to a watch list.

Add these stocks to a watchlist each day, and begin to follow their movements. If the trend continues above the 30 day high, you might find some of the best stocks to buy this way.

Oversold Stocks With Rising Momentum

Everyone loves to find oversold stocks. They can be the best stocks to buy if you pick the right ones. However, an oversold stock can stay oversold for a long time, so you need to use a screener to indicator when the momentum could be changing.

In the box titled “Popular” you can use our pre-set filter named “Oversold and Momentum Rising”. This takes RSI and Stochastic to find oversold levels, but combines a rising 10 period momentum indicator.

So the results displayed in the charts below the filter will show stocks which have been falling but momentum is beginning to rise.

The trick here is not to simply buy these stocks, but to add them to your monitor and view the charts each day. The best stocks to buy based on this filter will usually come after a bounce from a support. It may be an all-time low, a 52 week low or maybe a previous support level.

For instance, on the chart below, USDP was detected by this filter 3 days ago to be oversold but have rising momentum. When you zoom out on the chart you can see clearly that even though this stock was short term oversold, longer term it is in an upward trend. This could be a good stock to buy.

USDP

The low touched just above a previous high from late last year, which could offer support, and momentum is rising. This might be a “dip” which presents a good entry point. It also presents a good place for a stop loss below that support, for you to manage your risk.

Take the best results from this screener each day, add them to a watchlist and begin to find some of the best stocks you can buy based on technical levels.


Take from https://www.stockmonitor.com/blog/finding-the-best-stocks-to-buy-based-on-technical-screener-results/

Tuesday 4 October 2016

Here’s What’s Inside The Best Paid Stock Screener

Inside the best paid stock screener you would expect to find a whole bunch of useful tools, ready to use, with the ability to modify them easy to suit your needs. Here I’ll explain how easy it is to modify any of our pre-set filters to enable you to become a true market wizard.

Our RSI stock screener pre-sets cover just about everything a trader could need, like crossing above 70, crossing 50, above 80 for 10 periods etc, however if you want to adjust them it’s really easy. Once you select the filter, you will see a small blue edit button next to it’s name. If you hit that the filter builder page opens, and here you can adjust the settings, add further filters or completely change it! Save, and it’s ready to use.

unusual volume screenerFinding stocks that have unusual volume is a piece of cake. Already in the main filter we have a whole bunch of nice pre-sets, covering volume up 100% from 30 day average, volume up 100% from last bar etc. Again, to adjust them simply select the filter, hit the edit button and adjust it to how you need. You can also add another criteria, maybe unusual volume and rising RSI? Super easy, and takes 5 minutes.

You can also filter by candlestick patterns. Which is a good feature, if you combine it with an indicator. Maybe you want to find doji candlesticks whilst RSI is overbought or oversold? Simply edit the pre-set and add those extra criteria into the boxes, and away you go.

Another effective way to use our platform is to build watchlists around sectors or industries. You can keep an eye on which sectors are hot, and scan them for various patterns and select some potential winners. You can also build watchlists of stocks that have, as an example, recently moved above a long term moving average, or recently made a Golden Cross. Then run the filter exclusively on these watchlists for things like, RSI coming out of oversold, price making a new 30 day high, etc.

There are so many ways to get the best from our paid stock screener to make your analysis easy, and find some winning stocks to watch. Try it free today and see how it can help you.


Take from https://www.stockmonitor.com/blog/heres-whats-inside-the-best-paid-stock-screener/

Wednesday 6 July 2016

Using The Candlestick Scanner And Finding Entry Points in Stocks

Using our candlestick scanner it’s easy to find popular patterns such as hammer candlesticks or engulfing candles. You can choose from a huge selection of patterns in our screener, but which ones are effective and how can they be used in your technical analysis?

Below I’ve walked through a couple of example strategies for using hammer candlesticks to find support or resistance rejections. Often these candlesticks are trying to tell you a story, namely that the price is rejected and the market sees no value, or volume, above or below the long wick that forms.

If these wicks are printed at previous highs, lows or obvious gaps in the price, it’s worth watching how stock prices behave over the coming days. More often than not and opportunity arises to make some profit.

JCP Stock Price Analysis

First up we look at JCP stock price, and right away you see a huge hammer after a gap up in February, and a resistance rejection after it has made a high. After the hammer rejection of the high, JCP stock price went on to fall from $11 to below $8. If you were long, it was a warning sign to watch for weakness, if you were looking to get short it was a heads up for a break of short term support of $11.

jcp stock price chart

After the fall JCP stock price gapped back down through the February gap up. Which shows investors really didn’t want to trade in that price range. Then what followed was a series of rejections of the gap and candles inside. Will it head lower now? It’s not certain, but a breakout of $8 could signal some further weakness.

WMT Stock Price Analysis

Next we take a look at WMT stock price. This is a different scenario, because the stock price is in a steady trend. However the hammer candlesticks can still tell a story, even if it’s not obvious at first glance.

When stock prices are trending they often pull back to retest the last high in the trend. Traders and investors look for retraces to get in on a trend. Hammers can show us that previous highs or lows are being respected and offer some short term support or resistance.

In this example, the first hammer highlighted is a back test of the previous high. This was rejected swiftly, and WMT stock price continued meandering its way up for the whole of April.

wmt stock price chart

After the stock price broke the 2016 high (in May) it consolidated above it, but left a couple of small hammer candlesticks which were telling you that price is being bought each time the support is approached.

There’s interest at that level, and it should offer a place of support, or a level for a stop loss to be placed under if you entered the trade around here.

These are just two quick examples of how you can use our candlestick scanner to find interesting price action. Once you find a pattern, training your eyes to spot the support and resistance is crucial.

Have a go yourself, and begin to look left of the candles that you find. You will start to spot the important levels and build some very interesting watch lists.


Take from https://www.stockmonitor.com/blog/using-the-candlestick-scanner-and-finding-entry-points-in-stocks/

Wednesday 15 June 2016

Screener and Technical Indicators on CRM, FB and JCP

After 4 days of downside across the main US indices, futures seem to be pointing to a higher open on Wednesday 15th June. Whether this strength last throughout the session remains to be seen, but here we run our scans on some stocks with potential to move today based on our technical indicator screeners.

First of all (CRM) Salesforce we featured in our last blog post here, had just broken above a high for 2016. Whilst there was no clear resistance above, it was open to sentiment being the momentum leader.

CRM pushed on to a high of around $84.50, and began to retrace just as the general market turned. However, for now it is holding above the horizontal blue line on the chart below. Underneath this, there is risk that it could close the gap and fall lower if the market remains weak. Proceed with caution, but whilst it holds up above $80, there could be support forming.

crm

Facebook (FB) stock price has moved dangerously below a clear horizontal support over the last few sessions. The gap down at the weekly open has left an “island” pattern up above the line on the chart below. Failure to close that gap could mean further falls on market weakness.

However, the fundamentals remain strong at Facebook, so we would expect the stock price to find a support somewhere soon, maybe somewhere between $110 and $112 in the short term. One thing is certain, is that volume will remain strong whichever direction it is trading.

https://www.stockmonitor.com/quote/fb/

J.C Penney (JCP) made a strong bullish rise in its stock price from the January low and almost doubled in value. JCP is a Cyclical Consumer Goods stock and would normally be associated with stronger gains when the market is weaker. So saying as it has retraced most of the January/February move up it may be one to add to your watch list and monitor for further strength over the summer months.

Support and risk would have to be for price heading below the $6 to $7 level. Below there, coupled with sector weakness, and the price could slide further. However, there are many who swing trade this stock up and down, often. It has a habit of moving down to a support or recent low, and turning to retest the last highs.

jcp

To start monitoring your stocks and running technical analysis screeners, login and register free at the button below.


Take from https://www.stockmonitor.com/blog/screener-and-technical-indicators-on-crm-fb-and-jcp/