Monday 30 May 2016

Using A Technical Analysis Screener To Find Stocks On The Move

This week we added a new pre-set filter to our technical analysis screener, stocks that have moved up or down by 5%, 10% and 15%. You might find this a easy way to see the strongest or weakest stocks on the market each day.

In this post, I’d like to show you an idea of using the highest climbers and volume to discover new trading candidates.

 As you should know, volume tells you how many transactions have happened in a particular stock. Whilst it’s useful to know whether it was buying or selling volume, sometimes you don’t even need this information.

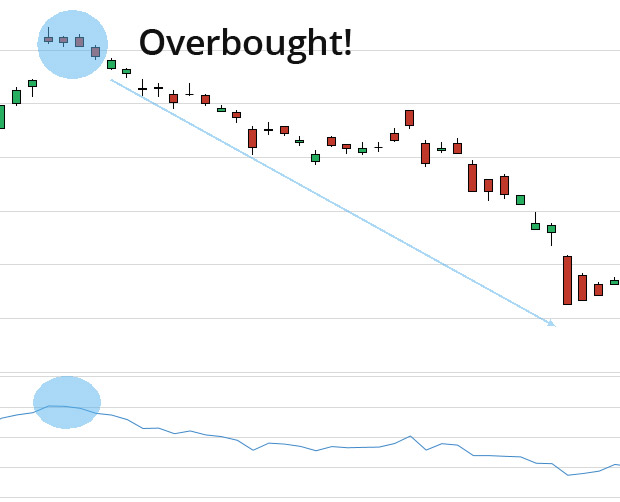
All you need to understand is there is currently increased interest in the movement of the stock. By using our volume higher than 30 day average filter, you are able to discover stocks which have people buying and selling more than usual. Combining this filter with stocks that have printed a strong gain can give you the direction that the traders are taking.

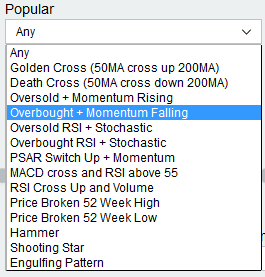
Let’s look at a quick example. I have just run the “Change up 5%” filter on the S&P500. It produced 4 stocks that have moved up by that amount today. Next I combined it with “Volume up 25% to 50% from 30 candle average”.

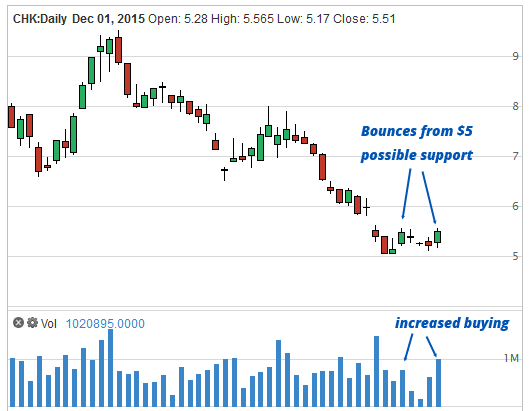
It left one candidate. CHK. Looking at the chart, you can see that it bounced by a similar amount a few days ago, with a similar amount of buying volume, from around the $5 area. This is telling you that there are buyers who see some value at this price, and could end up being a possible support.


chk stock

Now it would be foolish to jump straight in and buy on this signal. But it's certainly worth watching the stock in your watch list.

Looking in the news next to this chart, there is an article dated today that has the title: Analysts Set Chesapeake Energy Co. (NYSE:CHK) Target Price at $11.10. This has maybe prompted some buyers, and it would be worth seeing if the strength can continue and give an opportunity to hop on board. After all, a rise to $11 would be near 100% gain from this level. If you want to see this stock, and discover many more opportunities using our technical analysis screener.

First posted at:  https://www.stockmonitor.com/blog/using-a-technical-analysis-screener-to-find-stocks-on-the-move/

Wednesday 25 May 2016

Technical Analysis and Screener on SBUX, CRM and BIDU

Recent strength in the US stock market has given a lift to a whole bunch of stocks. Here we run our stock scanner and technical analysis charts over a few of our members most watched stocks.

Starbucks (SBUX) stock price has been on the move from a two month low of just above $54. Firstly, running our scan for MACD cross up, we see that the MACD is crossing up for the first time in over 30 days. This tells us price is moving in a positive way.

The stochastic on SBUX also crossed up whilst it was consolidating at the recent lows, and with this move RSI has come from 30 (often classed as oversold) to climb above 40. A sustained move in price should get RSI up and above 50 which is considered to be strong.

Short term, the 50 period moving average is above, just near the gap down from April 22nd. Any rise from here could be heading towards that area, so an increase to $58 – $59 is a possibility. Risk is a break below the low of $54.

sbux-stock-chart

Salesforce (CRM) stock price gapped up above $80 last week, and the technical analysis has remained strong. The MACD crossed up above the zero line, RSI has continued to climb high and now stands at 75.

The surge in volume on May 19th and subsequent strength suggests that the bears are not in control here. CRM stock price is above both the 100 moving average and the 50 moving average, with all technical indicators suggesting that there is strength on the way.

A break above $83 would mean a new 2 year high for Starbucks, and if it can hold above that high, there is no resistance to base analysis on. Target is anyone’s guess, but risk is a breakdown below $80.

crm-stock-chart

Baidu (BIDU) stock price has rallied from a 3 month low of $158.50 to close yesterday at $175.60. This has been a strong technical move coupled with an increase in volume over the last 30 days. Our MACD screener has detected that MACD crossed up yesterday, and RSI screener has detected that today it’s moved above 50.

Stochastic is high, but not overbought and price is heading towards the 50 moving average. If the strength continues, a retest of the recent resistance at $197 could be possible. Risk is breakdown below $165.

bidu-stock-chart

Start using our stock scanner to help you find the best possible entries for stocks on the US market.

Register Free Here!


Take from https://www.stockmonitor.com/blog/technical-analysis-and-screener-on-sbux-crm-and-bidu/

Wednesday 11 May 2016

Brand New Stock Portfolio Features We Added

We’ve recently added some updates to our stock portfolio; this post is going to explain what they are, how you can use them and why they are important.

One of the features users have frequently requested is to have the ability to add stocks in bulk from the stock lists they produce from their scans. We have now added this feature, but rather than just stop there we also spiced it up a little.

Here is what you can do direct from any scan list, or sector/index table inside Stock Monitor.

Bulk add stocks from the current window, to a newly created, or existing portfolio. Because you can have unlimited portfolios, it’s now easier than ever to test trade filters in real time. Simply check the boxes at the start of each row, or top right on each mini chart, and click “Add Selected To Portfolio”. You will be presented with a window.

In the new window you can select an existing portfolio, or create a new one only for these stocks.

Here’s the good part. You can now save time by creating one transaction in the top row, then click the grey “fill down” arrow, and the same date, amount of shares are filled in to all the stocks you selected.

new portfolio window

Add a stop loss! With this update you can test trade any scans you like, easy. Add a stop loss amount in the row, and fill down, all stocks will have this applied. You can set a percentage value, or a specific price for an individual stock.

This means you can now test trade using an unlimited amount of portfolios, based on scans you make on stocks within various sectors, industries or indexes.

We believe this is an excellent tool for your trading set ups. You can build a custom scan, run it on various sets of stocks, save all the stocks to different portfolios and see the results each time you log in. No more removing stocks manually!

Get started today, and see how this can become an important part of your trading.

Try It Free Here!

PS: Here’s a short video we prepared showing how to quickly add stocks and set stop losses.


Take from https://www.stockmonitor.com/blog/brand-new-stock-portfolio-features-we-added/

Thursday 5 May 2016

How To Find Overbought or Oversold Stocks Easy

If you’d like to find the most overbought or oversold stocks today, or any day, we’ve made this really simple to do inside stockmonitor.com. With the new addition of popular stock scans to our technical analysis screener you can find overbought stocks in seconds.

In this article I’ll quickly run over what our scanner looks for, how it determines whether a stock is oversold or overbought and a short tutorial video of how to do it.

overboughtThe most common way to look for an overbought or oversold stock is to use a relative strength index. This indicator if over the 70 level is commonly thought to be overbought, if under the 30 level it is usually classed as oversold. However, in our scanner to narrow down the candidates we also use a high or low value in the stochastic indicator.

Often when a RSI indicator is at the high level it can stay there for quite a while. By adding the stochastic we are determining which of these stocks are overbought or oversold and also at a possible extreme.

We also have a version of this scan which uses the same two indicators but looks for momentum to be falling or rising during a three-day period. This can indicate a stock that is overbought or oversold, is at an extreme with stochastic and could be looking to reverse.

You can add any of these stocks that you find really quickly to watchlist or portfolio direct from the filter results table. Simply select the check boxes and click the button above the table.

Try This Now!

Watch a short video below and see how easy it is to find these stocks, and how quickly it is to add them to watchlist or portfolios.


Take from https://www.stockmonitor.com/blog/how-to-find-overbought-or-oversold-stocks-easy/

Tuesday 3 May 2016

Using Our RSI Stock Screener For Fast Overbought/Oversold Analysis

The relative strength indicator is one of the most widely used indicators by investors and traders alike. Here we will show you how our RSI stock screener works, and a show you the fast way to pull up lists of stocks that are overbought or oversold.

An RSI indicator is deemed to be in overbought territory if the indicator crossed up above 70. However, in many situations this is just the beginning of being in an overbought level. This level can increase all the way up to 90 or 100 at an extreme, which means stocks can continue to stay overbought for a very long time and still move up in price.

Using our RSI stock screener you can find stocks easy that are above RSI 70, but the secret trick is to also watch for momentum to begin falling whilst the stock is overbought, and to confirm the overbought status with the stochastic indicator. We can show you this too!

How The RSI Screener Works

On the main filter page, we recently build a new box called “Popular”. Inside this box there is an option to filter “Overbought + Momentum Falling”.

overbought-rsi-screener

When you select this option, it will display stocks which have these characteristics in the indicators.

  • RSI Indicator level greater than 70
  • Stochastic (Fast setting) greater than 90
  • Momentum decreasing for previous 3 days

Try The Filter Now!

What this means is the RSI stock screener has found stocks that are in high overbought situations, yet momentum seems to be dropping off. This can be a good scan for one of two things.

The price has hit a resistance, and may turn down.

This could be a pullback in a trend, and offer an opportunity soon to jump on board.

With either of these you need to understand basic support or resistance.

For example, if this is a pullback in a trend, you may want to add the stock to your watch list and look for it to retrace back to a previous high, or an area it broke above recently, before deciding if the stock fits your risk profile.

If it is a turning point, you might want to be sure that the level it began to retrace from was a string resistance in the past. Zooming out on a technical analysis chart to view a few years of data will show you.

We have the exact opposite of this filter in the “Popular” box too. It will find stocks that are oversold, and momentum has been rising for 3 days. Check “Oversold + Momentum Rising”.

In addition to our preset filter, you can also customize any of the RSI screeners in the box named “Oscillators”.

When you run a filter, an “edit or clone” button appears. By clicking this you can adjust the levels or add further criteria to the scan, easily, using our custom filter builder. Save the new filter, and it will be available in your custom list each time you visit.

Get started now and begin finding overbought and oversold stocks.


Take from https://www.stockmonitor.com/blog/using-our-rsi-stock-screener-for-fast-overbought-analysis/